Baraj Aynası
How full are Istanbul's reservoirs, seen from orbit? Satellite estimates with error bars.
Estimates from water surface area, not official figures. Istanbul's official occupancy is published by İSKİ.
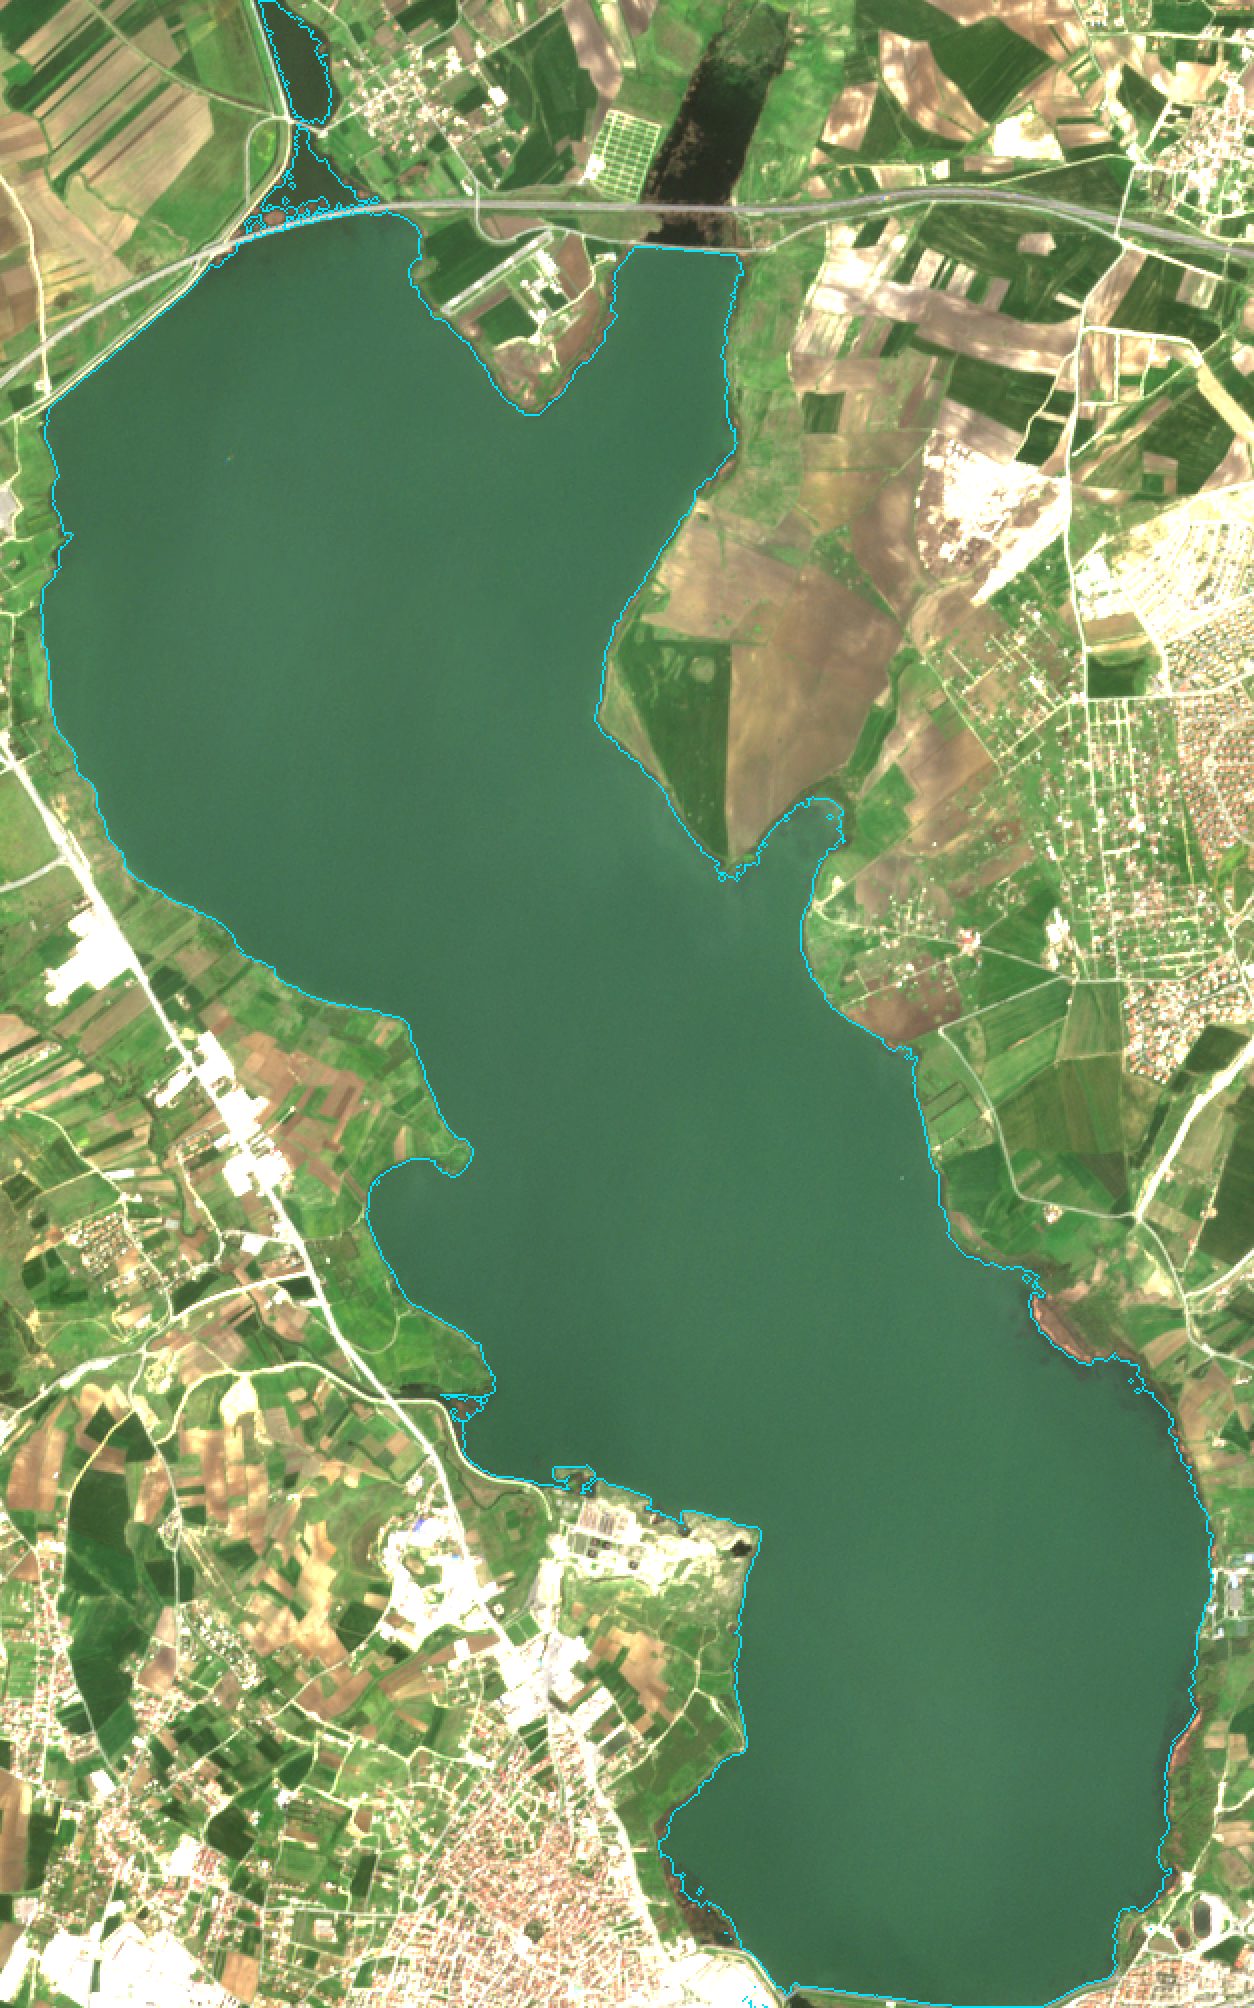 24 Apr 2022 · 98% full · 23.9 km²
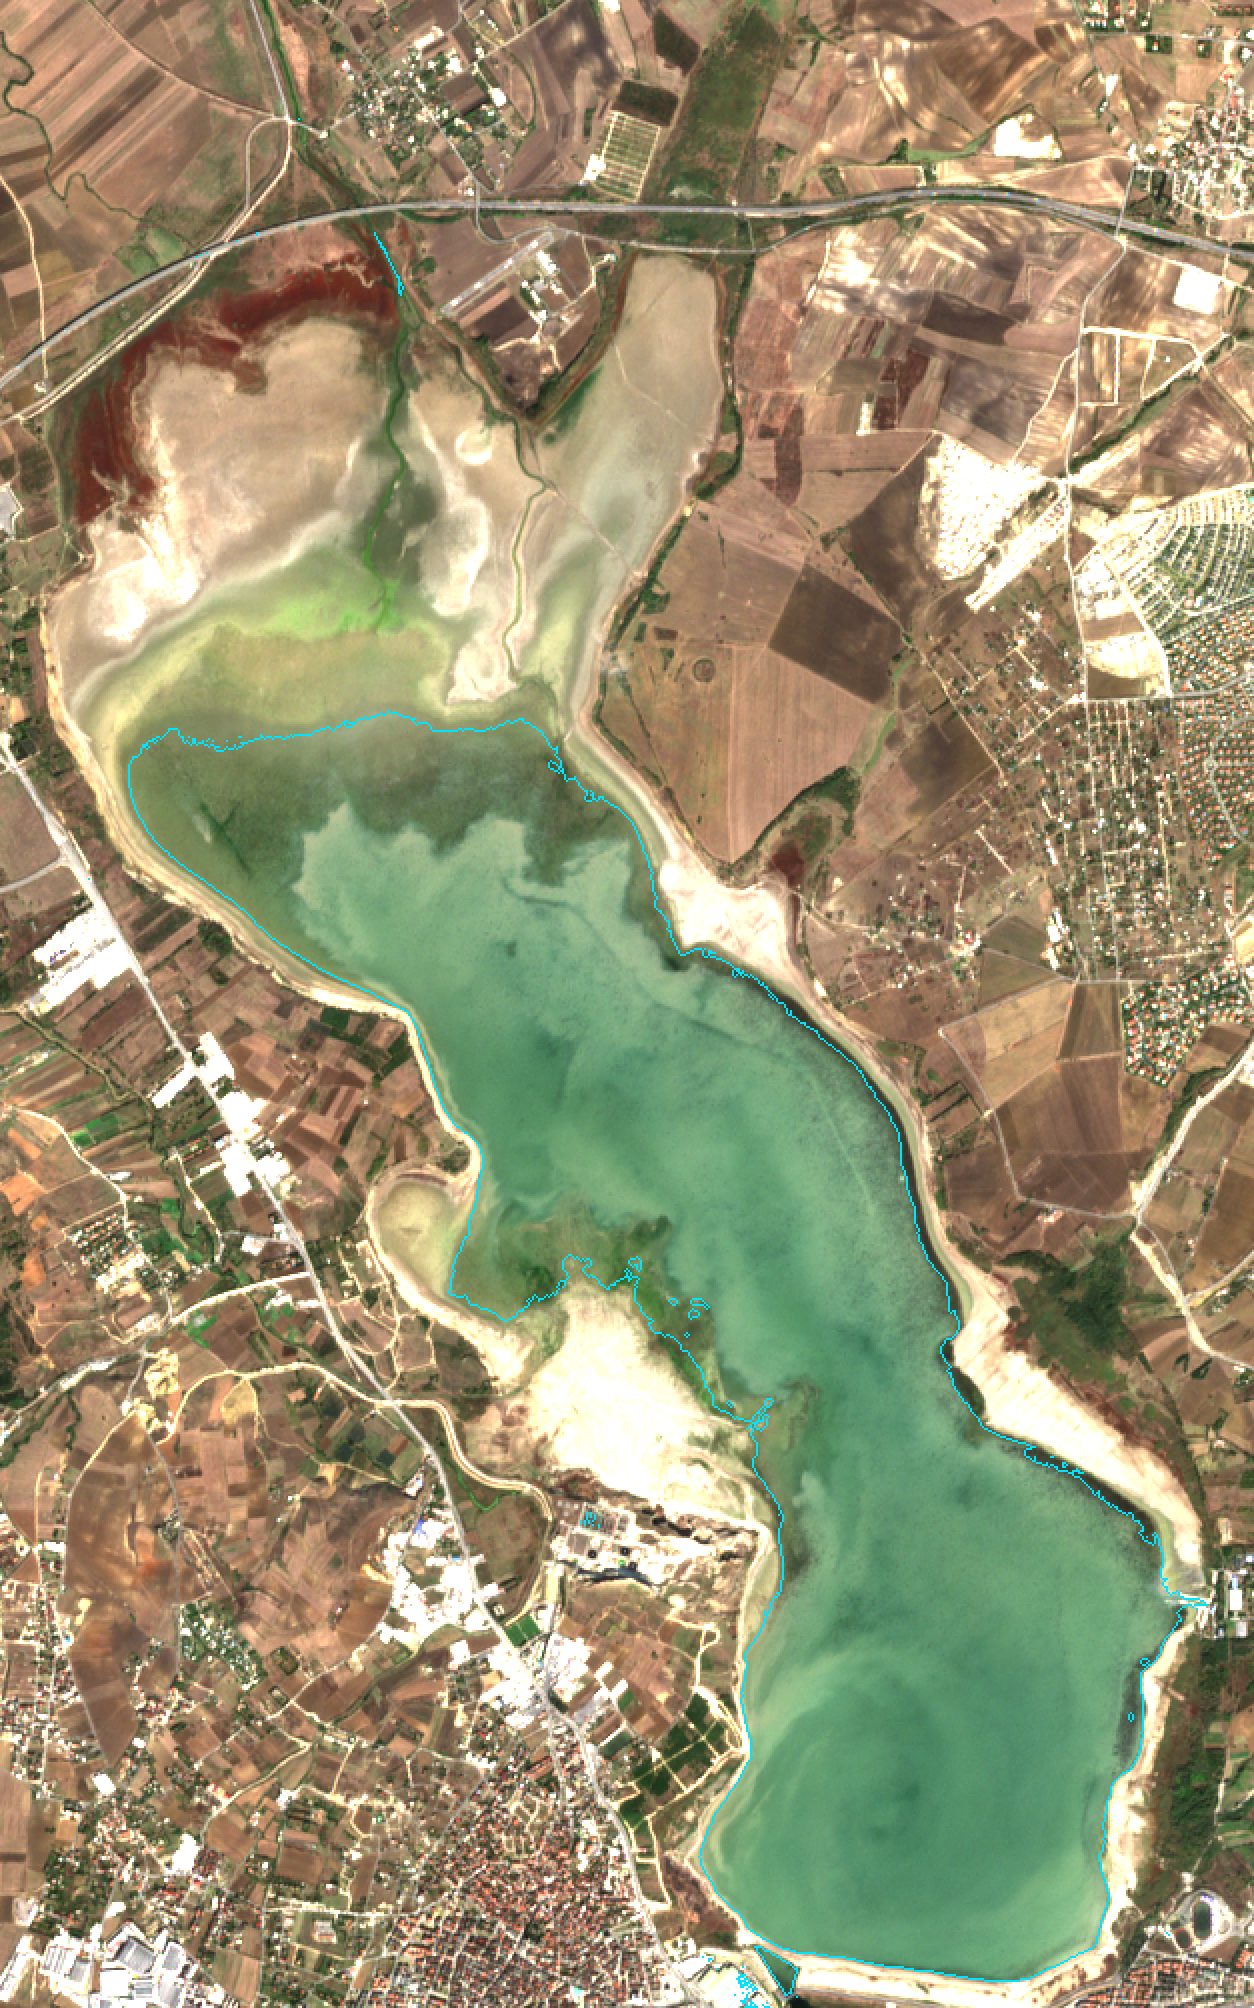 14 Oct 2023 · 4% full · 12.2 km²
Latest satellite estimates
Ten reservoirs, 2017–2026
Each dot is one cloud-free Sentinel-2 scene turned into an occupancy estimate. Until 19 February 2024 the curve was fitted against İBB's daily figures; after that the dots are satellite-only and are checked against the İSKİ figures we could collect. Hover a chart for values and the 90% error bar. Dots far below the line, mostly in May and June, are scenes where algae hide the water from NDWI; they are kept on the charts. Hollow purple circles are radar estimates, from 2024 on and only on the offered reservoirs.
Estimates offered
These reservoirs passed the held-out test; their satellite estimates are shown above.
Not offered
Shown for transparency: these failed one of the tests or are too small to measure.
How it works
- Every Sentinel-2 L2A scene of the three tiles over Istanbul's reservoirs from 2017 on is clipped to each reservoir, and clouds are masked with the scene classification layer.
- Water is mapped with NDWI, a ratio of the green and near-infrared bands: water reflects green light and absorbs near infrared. Water area is counted inside an outline drawn from each reservoir's high-water extent.
- For each reservoir, a curve from water area to occupancy is fitted on scenes up to June 2022 and tested on July 2022 to February 2024, the end of İBB's open daily data. The fit ignores scenes far off the curve and must rise with area.
- The 90% error bar comes from how far the curve misses on years it did not see. After February 2024, the frozen curves are scored against İSKİ's reported figures, and that score is refreshed daily.
- Clouds can hide a reservoir for weeks, so Sentinel-1 radar passes give a second, separate estimate every five or six days. Calm water looks dark to radar, so pixels below a fixed level for each reservoir count as water. Radar has its own curves and error bars, was judged by a rule written down before it was scored, and is never blended into the estimates above.
Where it falls short
The project set itself one stop rule: if the error on the four largest reservoirs exceeded 10 occupancy points, publish the gap and stop. It was met for Terkos, Büyükçekmece and Darlık. This page is that published gap; offering estimates for the reservoirs that passed was a later decision that the rule does not cover.
Three things cause it. The test years held the 2023 record drought, lower than anything the curves had seen. Shape: in a shallow lagoon like Büyükçekmece, area keeps shrinking while little water is left, in a steep valley like Darlık area hardly changes at all, and Terkos has reed beds on its margins. And late-spring scenes where algae turn the water's colour, so NDWI misses it.
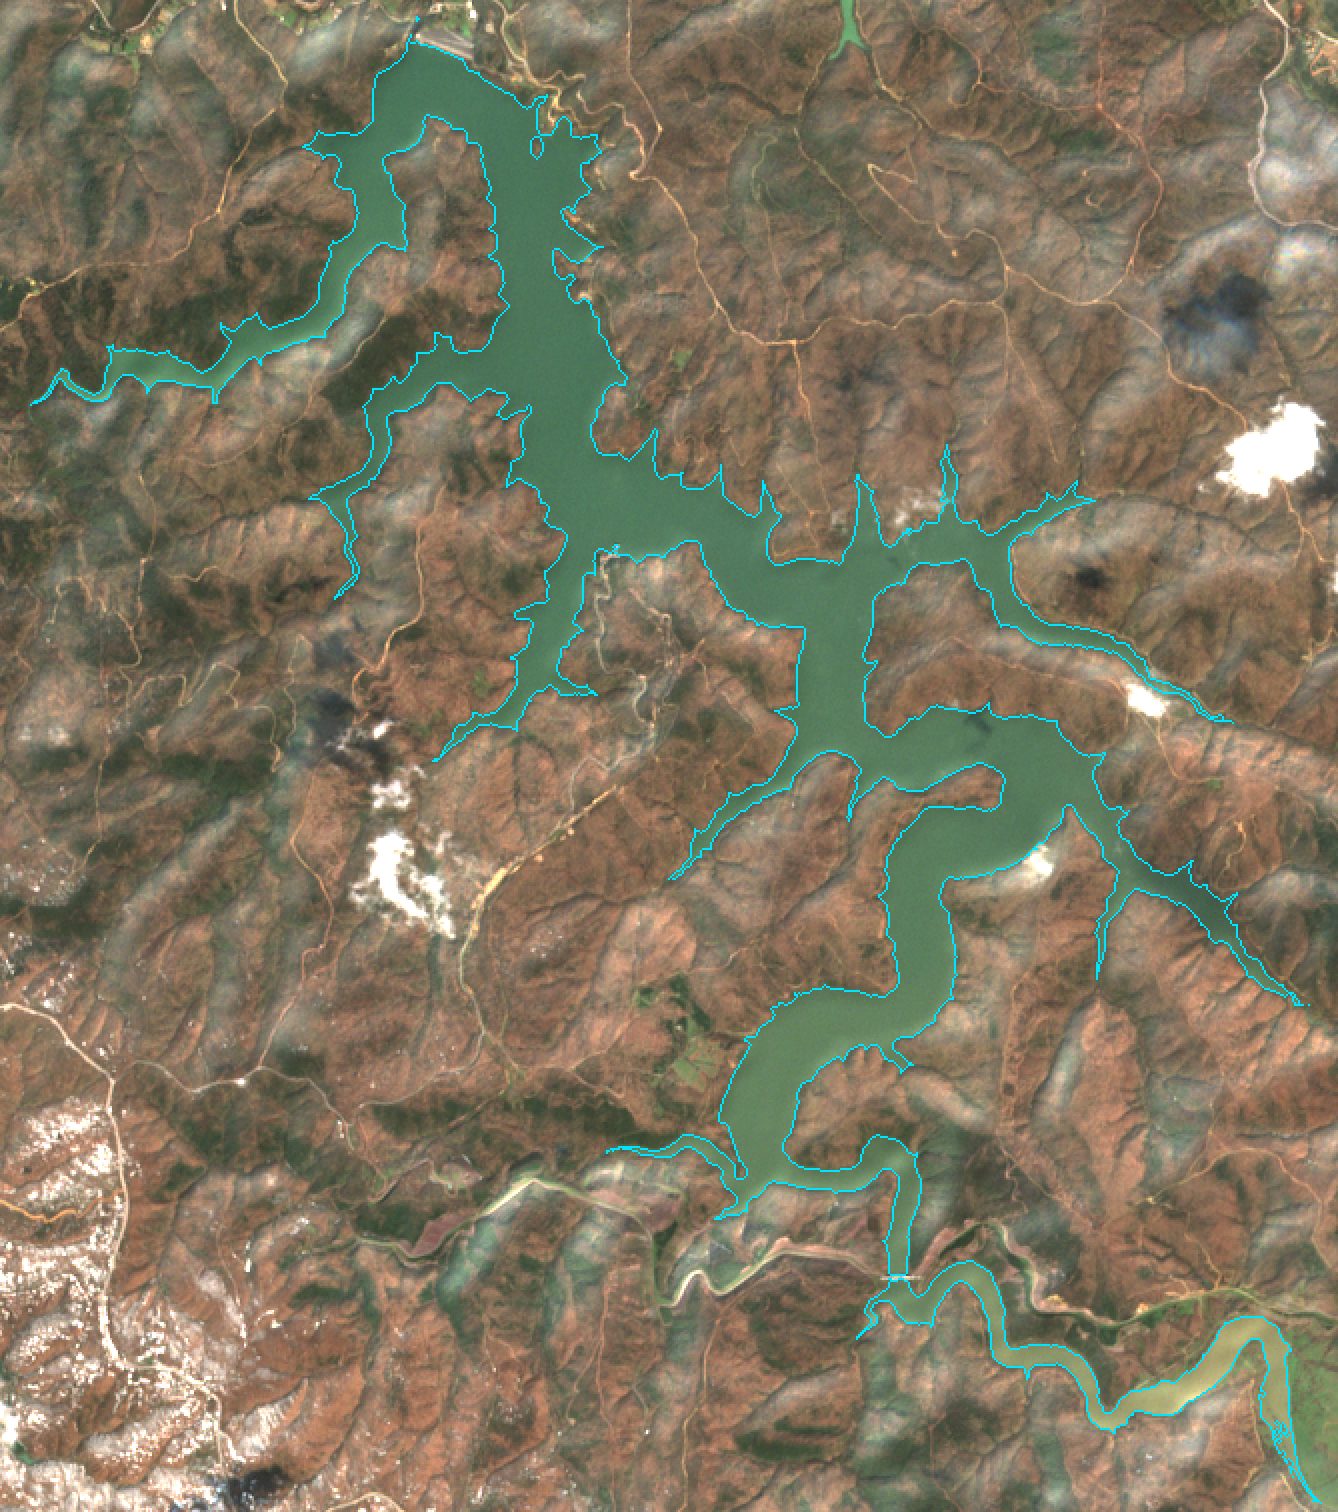 25 Mar 2022 · 100% full · 5.4 km²
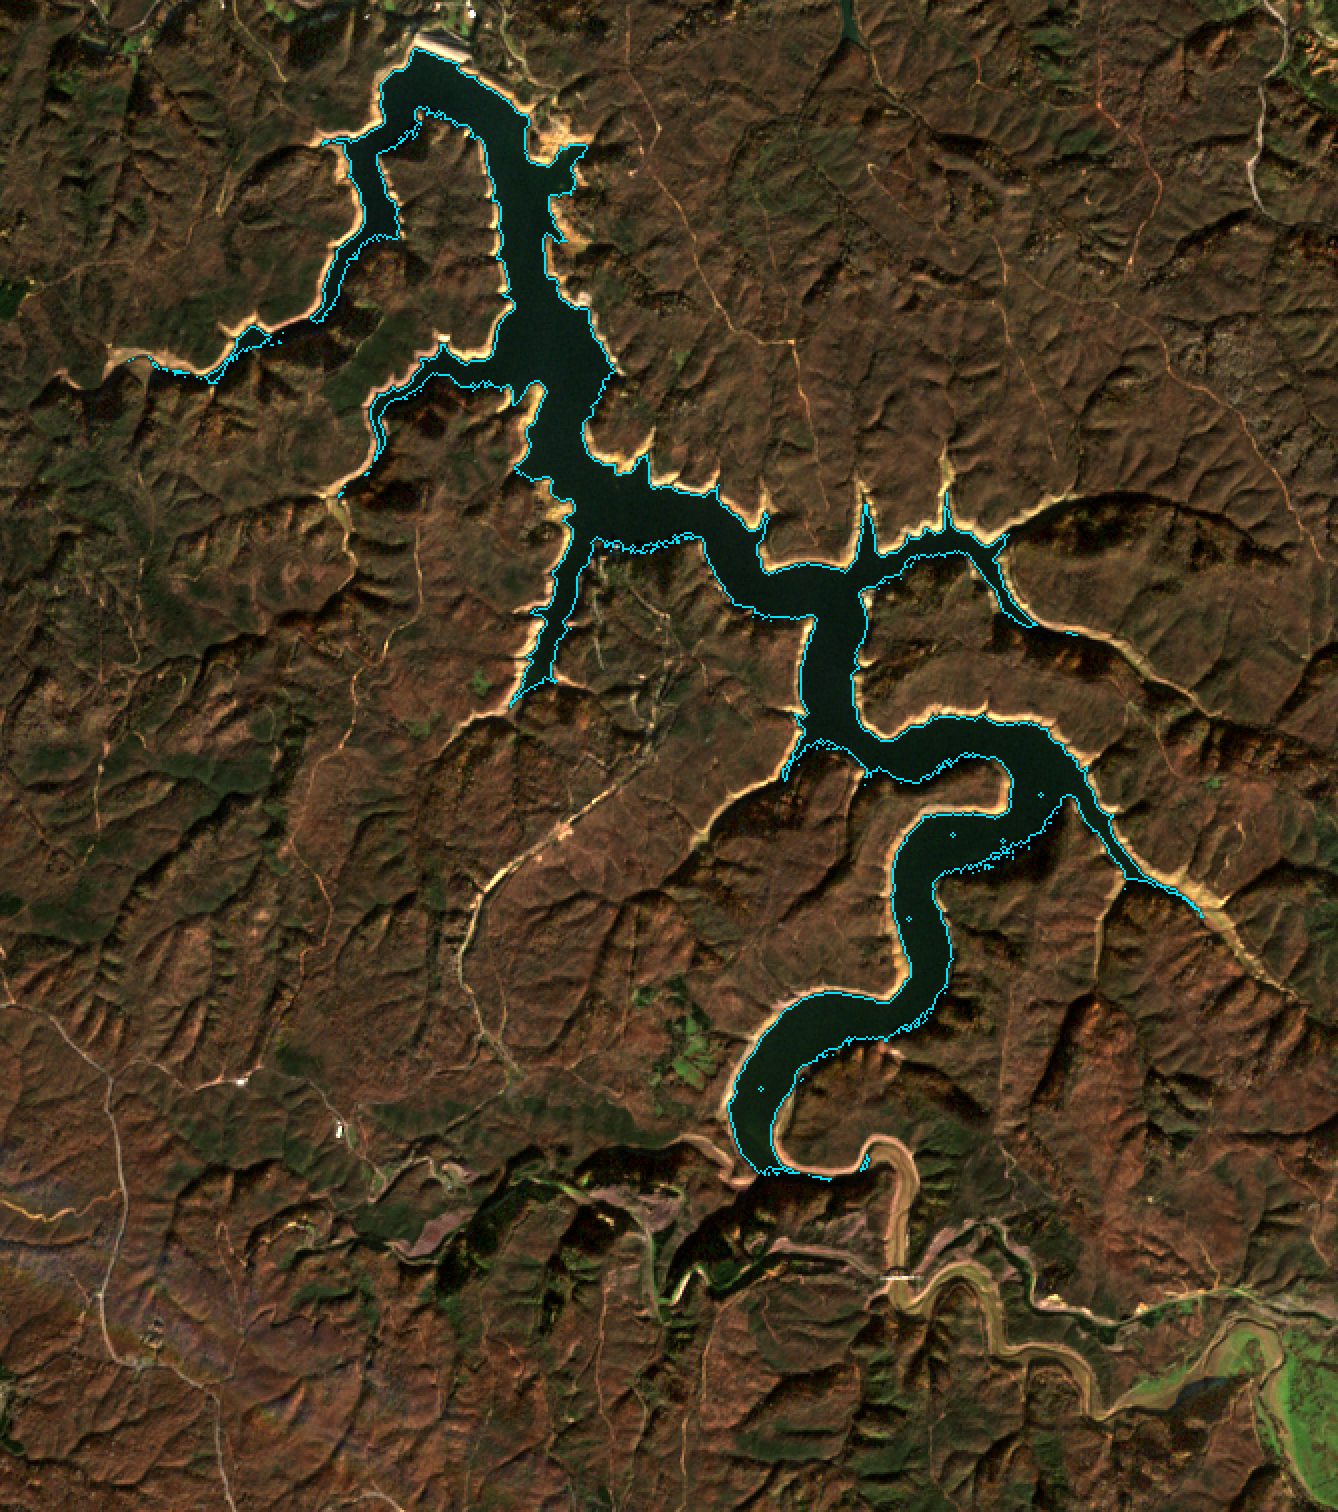 9 Jan 2023 · 29% full · 2.9 km²
A learned water mask
A small U-Net, trained on 236 image patches labelled by AI agents and spot-checked by the author, was tried in place of the NDWI threshold. It keeps the water in algal scenes that NDWI drops, which cuts Darlık's error from 11.7 to 5.3 points on average over five training runs. It does not fix Terkos or Büyükçekmece, whose gap comes from the 2023 low and their shape, and the estimates shown here still use NDWI.
| Reservoir | Status | Capacity (million m³) | Test error | Error vs İSKİ | İSKİ dates | Error bar (90%) | Test error, radar | Radar vs İSKİ | Test error, U-Net (5 runs) | Best guess without imagery |
|---|
Errors are average misses in occupancy points. Test error: July 2022 to February 2024, against İBB's daily figures; values above the 10-point stop line on the four largest reservoirs are marked ▲. Error vs İSKİ: from 2024 on, on the dates that pair with a cloud-free scene, refreshed daily; rough where there are few dates. The U-Net column is an alternative water mask, not used for the estimates; it is the mean of five training runs. The radar columns are the same two tests for Sentinel-1; radar estimates appear only on the offered reservoirs. The last column is the test error of the best of three guesses that use no imagery (the season's average, the figure a year earlier, the last figure before the test), on the same dates as the first test error. Every satellite series misses less on average, narrowly for Darlık; against İSKİ, a guess does better for Terkos and Kazandere, on only 2 to 3 dates. Details.
Data and credits
Reservoir occupancy to 19 February 2024: İstanbul Barajları Günlük Doluluk Oranları, İBB Açık Veri Portalı, under the İBB Open Data License. Atıf 4.0 Uluslararası (CC BY 4.0) kapsamında lisanslanan kamu sektörü bilgilerini içerir.
Imagery: Contains modified Copernicus Sentinel data 2017–2026, accessed through the Microsoft Planetary Computer.
Radar: Sentinel-1 RTC, processed by Catalyst and hosted on the Microsoft Planetary Computer, under CC BY 4.0.
Occupancy after February 2024: İSKİ, iski.istanbul/baraj-doluluk, collected from the page and from Wayback Machine copies and shown on the charts with this credit. The page is read once a day.
Code and full results: github.com/Esquetta/baraj-aynasi (MIT licence). Built by Furkan Tasci.